Sunday, December 31, 2017

Jim Rickards: Gold and Its Role in the Next Financial Crises


Jim Rickards On $10,000.00 Gold: It's important to understand that this isn't a made up number or one I throw out there just to get attention. 

It's the implied, non-inflationary price of gold in a system where you have either a gold system or some reference to gold. Now, there's not a central bank in the world that wants the gold standard, but they may have to go to it — not because they want to, but because they have to — in order to restore confidence in some sort of future financial crisis. The problem right now is that central banks have not normalized their balance sheet since 2009. They're trying, but it's not even close. 

If we had another crisis tomorrow, and you had to do QE4 and QE5, how could you do that when you're already at $4 trillion? They might have to turn to the IMF or SDR or to Gold.

Then, if you go back to the gold standard, you have to get the price right. People say there's not enough gold to support a gold standard. That's nonsense. There's always enough gold, it's just a question of price. Take Japan, Europe, China and the US — the big four economies — their m1 is approximately $24 trillion. If you had 40% gold backing, that would be $9.6 trillion. There are about 33,000 tons of official gold in the world. So you just divide 9.6 trillion by 33,000 tons and what you get is about $10,000 an ounce. 

If you had a gold standard with a lower price, that would be deflationary. You'd have to reduce the money supply. That was the mistake that was made in 1925. It did contribute to the Great Depression, and it wasn't because of gold, it was because they got the price wrong. So to have a gold standard today and not cause another depression, you'd have to have a price around $10,000 an ounce.


Wednesday, December 27, 2017

The Fear of Missing Out


A lesson in bubble dynamics and market crashes...

To PARAPHRASE one of the great gems of Wall Street wisdom, "Nothing infuriates a man more than the sight of other people making money," writes Jim Rickards in The Daily Reckoning.

That's a pretty good description of what happens during the late stage of a stock market bubble. The bubble participants are making money (at least on a mark-to-market basis) every day.

Meanwhile, the more patient, prudent investor is stuck on the sidelines – allocated to cash or low-risk investments while watching everyone else have fun. This is especially true today when the bubble is not confined to the stock market but includes exotic sideshows like crypto-currencies and Chinese real estate.

It gets even worse when investors are taunted by headlines like the one in a recent article, "Investors Can Either Buy Bubbles or Be Left Far Behind." The article is a case study in the "Bubblicious Portfolio". Infuriating indeed. Actually it should not be.

On a risk-adjusted basis, the prudent investor is not missing much.

When markets go up 10%, 20% or more in short periods, market participants think of their gains as money in the bank. Yet, that's not true unless you sell and cash out of the market. Few do this because they're afraid to "miss out" on continued gains.

The problem comes when the bubble bursts and losses of 30%, 40% or more pile up quickly. Investors tell themselves they'll be smart enough to get out in time, but that's not true either.

Typically investors don't believe the tape. They "buy the dips" (which keep dipping lower), then they refuse to sell until they "get back to even", which can take ten years. These are predictable behaviors of real investors caught up in real bubbles.

It's better just to diversity, build up a cash reserve, have some gold for catastrophe insurance, and then wait out the bubble crowd. When the crash comes, which it always does, you'll be well positioned to shop for high-quality bargains amid the rubble. Then you'll participate in the next long upswing without today's risks of a sudden meltdown.

Okay, so I just argued that the stock market (and other markets) are in bubbles. But where's the actual proof for this?

Actually, it's everywhere.

The Shiller CAPE ratio (a good indicator of how expensive stocks are) is at levels only seen at the 1929 crash that started the Great Depression, and the 2000 dot.com bubble. Likewise, the market capitalization-to-GDP ratio is above the level of the 2008 panic and comparable to the 1929 crash.

The list goes on, including historically low volatility and unprecedented complacency on the part of investors.

For almost a year, one of the most profitable trading strategies has been to sell volatility. That's about to change.

Since the election of Donald Trump stocks have been a one-way bet. They almost always go up, and have hit record highs day after day. The strategy of selling volatility has been so profitable that promoters tout it to investors as a source of "steady, low-risk income".

Nothing could be further from the truth.

Yes, sellers of volatility have made steady profits the past year. But the strategy is extremely risky and you could lose all of your profits in a single bad day.

Think of this strategy as betting your life's savings on red at a roulette table. If the wheel comes up red, you double your money. But if you keep playing eventually the wheel will come up black and you'll lose everything.

That's what it's like to sell volatility. It feels good for a while, but eventually a black swan appears like the black number on the roulette wheel, and the sellers get wiped out. I focus on the shocks and unexpected events that others don't see.

In short, we have been on a volatility holiday. Volatility is historically low and has remained so for an unusually long period of time. The sellers of volatility have been collecting "steady income," yet this is really just a winning streak at the volatility casino.

I expect the wheel of fortune to turn and for luck to run out for the sellers.

But it's time to add another warning sign to the list. Certain high-yield (or "junk bond") indices have fallen below their 200-day moving average. This can be indicative of a stock market correction.

Junk bonds are riskier than equity. When they get in trouble, it's a sign that the corporate issuers are having trouble meeting their obligations. That in turn is indicative of reduced revenues or profits, tight financial conditions, and lower earnings.

Panics in October 1987 and December 1994 were preceded by distress in bonds about six months earlier. While there is no deterministic relationship, bonds are a good leading indicator of stocks because they are higher in the capital table and feel distress sooner. The October 1987 one-day 22% decline in stocks, and the December 1994 Tequila Crisis in Mexican debt were ugly for investors. The bond market gave a six-month early warning both times.

It may be doing so again.

But what the Fed? Is it setting markets up for a fall?

It's true that the Fed has been raising interest rates since 2015, and had engaged in tapering for two years before that. Yet, these actions hardly constitute tight money. The tightness or ease of monetary policy needs to be judged relative to financial and economic conditions.

You can have "easy money" at a 10% interest rate if inflation is running at 15% (something like the conditions of the late 1970s). In that world, the real interest rate is negative 5.0%, (10% minus 15% = -5%).

In effect, the bank pays you to borrow. That's easy money.

By most models including the famous Taylor Rule, rates in the US today should be about 2.5% instead of 1.0%. We have easy money today and have had since 2006. This comes on top of the "too low, for too long" policy of Alan Greenspan from 2002-04, which led directly to the housing bubble and collapse in 2007.

The US really has not had a hard money period since the mid-1990s. That's true of most of the developed economies also.

What's going to happen when central banks start to normalize interest rates and balance sheets and return to a true tight money policy in preparation for the next recession?

We're about to find out.

Central banks all over the world including the Fed, ECB, and the People's Bank of China are in the early stages of ending their decade-long (or longer) easy money policies. This tightening trend has little to do with inflation (there isn't any) and more to do with deflating asset bubbles and getting ready for a new downturn.

But, in following this policy, central bankers may actually pop the bubbles and cause the downturn they are getting ready to cure. This is one more reason, in addition to those described above, why the stock market bubble is about to implode.

It's important to realize that market crashes often happen not when everyone is worried about them, but when no one is worried about them.

Complacency and overconfidence are good leading indicators of an overvalued market set for a correction or worse.

- Source, Bullion Vault

Sunday, December 24, 2017

The Fed Is in Limbo


In yesterday’s analysis, I compared Janet Yellen to an athlete running the high-hurdles at a track meet. Her finish line is a rate hike on December 13.

The hurdles are inflation data, the Trump tax cut, and a government shutdown on December 8. She has to clear all three hurdles to make it to the finish line.

These hurdles are all conveniently time-stamped. The inflation data came out this morning, the tax bill vote is scheduled for Friday, and the government shutdown is scheduled for next Friday, December 8.

As New York Mayor Ed Koch used to ask, “How am I doin’?”

Well, the inflation data this morning was decisively… indecisive.

The particular metric in focus was the personal consumption expenditure core deflator on a year-over-year basis released monthly by the Commerce Department with a one-month lag. Call it PCE Core year-over-year for short.

Sounds technical, but it’s important because that’s the number the Fed watches. There are plenty of other inflation readings out there (CPI, PPI, core, non-core, trimmed mean, etc), but PCE Core year-over-year is the one the Fed uses to benchmark their performance in terms of their inflation goal.

The Fed’s target for PCE Core is 2%. The October reading released this morning was 1.4%. For weeks I’ve been saying that a 1.3% reading would put the rate hike on hold, and a 1.6% reading would make the rate hike a done deal. So, the actual reading of 1.4% was in the mushy middle of that easy-to-forecast range.

What’s interesting is that the prior month was also 1.4%, so the new number is unchanged from September. That’s not what the Fed wants to see. They want to see progress toward their 2% goal.

On the other hand, the 1.4% from September was a revised number. It was earlier reported at 1.3% (the same number as August).

You can read this two ways. If you see the August 1.3% as a low, then you can say the 1.4% readings for September and October were progress toward the Fed’s 2% target. It’s a thin reed, but Yellen could use this to justify her view that the year-long weakness in PCE Core is “transitory.”

On the other hand, these 0.1% moves month-to-month are really statistical noise and may even be due to rounding. The bigger picture is that PCE Core is weak and nowhere near the Fed’s target. Another rate hike in December could be a huge blunder if it slows the economy further and leads to more weakness in PCE Core.

On balance, the PCE Core number is probably just enough (barely) to justify a rate hike. I’ve raised my probability of a December rate hike from 30% to 55%. That’s what good Bayesians do; they update forecasts continually based on new data.

Of course, the market has been pricing in at a 100% probability for a few weeks. That’s fine, markets have been wildly wrong in the past. I’d rather stick with a good model and update continually than swing from one extreme to the other based on crowd behavior. My Bayesian statistical models (along with other scientific tools) have served me well for a long time and I’m sticking with them.

As John Maynard Keynes said, “When the facts change, I change my mind. What do you do, sir?” (Actually Keynes never said that, but it’s a wonderful quote attributed to him. Keynes would certainly agree).

What about the remaining two hurdles for our track-star Janet Yellen?

The tax bill vote is scheduled for Friday. If it passes the Senate, it will almost certainly become law in the next few weeks after the House and Senate versions are reconciled.

The stock market has already priced in a tax cut. Markets won’t go up much more if the bill passes because they already expect it to pass. But if the bill fails markets could plunge on the bad news.

That’s important. If it does not pass, the disappointment factor will be huge and could send the stock market tumbling. Something like that happened in 2008 when the TARP legislation failed. The Dow fell over 700 points in one day. (Congress got the message and passed TARP a few days later). The response would be much larger today, perhaps 1,000 Dow points or more, because the market is starting from a much higher level.

The fact is no one knows what will happen in the Senate; at least eight Senators are waiting for a “Manager’s Amendment” (basically a re-write of the entire bill) to make up their minds.

Call it 50/50; a coin toss. “Heads” the Senate passes the tax bill, “tails” they don’t. But if the tax cut fails and the market tumbles, the Fed will not raise rates.

Finally there’s the government shutdown if Republicans and Democrats cannot agree on spending. These are mostly for show; most of the government remains open and the shutdowns are usually resolved within a week or so.

That means finding some compromise on a long list of hot button issues including funding for Trump’s wall with Mexico, deportation of illegal immigrants brought to the U.S. as children (the “Dreamer Act” also referred to as “DACA”), funding for Planned Parenthood, funding for Obamacare (called “SCHIP”), and more.

We’ll see.

Still, it’s difficult to imagine the Fed hiking rates on December 13 if the government shuts down on December 8 and remains shut on the date of the FOMC meeting.

There’s not much middle ground between Democrats and Republicans on spending policy issues like immigration, Trump’s Wall, Obamacare bailouts, and a host of other hot button issues.

This looks like another 50/50 call. “Heads” the government stays open, “tails” the government shuts down.

The problem with two coin tosses is that the odds of getting “tails” at least once are 75%.

So, Yellen still has a long way to go before she crosses the finish line.

My trading recommendation is unchanged. The euro, yen, gold and Treasury notes are all fully priced for rate hike. If it happens, those instruments won’t change much because the event is priced. If there’s no rate hike, euros, gold, yen and Treasury notes will all soar.

So, there’s an asymmetry in the probable outcomes. If you go long euros, gold, yen and Treasury notes, you won’t lose much if the Fed hikes (assuming no geopolitical shocks), but you could win big if they don’t.

That’s the kind of coin toss I like. Heads I win, tails I don’t lose.

- Source, James Rickards via the Daily Reckoning

Wednesday, December 20, 2017

James Rickards: Bubble Dynamics and Market Crashes


To paraphrase one of the great gems of Wall Street wisdom, “Nothing infuriates a man more than the sight of other people making money.”

That’s a pretty good description of what happens during the late stage of a stock market bubble. The bubble participants are making money (at least on a mark-to-market basis) every day.

Meanwhile, the more patient, prudent investor is stuck on the sidelines — allocated to cash or low-risk investments while watching everyone else have fun. This is especially true today when the bubble is not confined to the stock market but includes exotic sideshows like crypto-currencies and Chinese real estate.

It gets even worse when investors are taunted by headlines like the one in a recent article, “Investors Can Either Buy Bubbles or Be Left Far Behind.” The article is a case study in the “Bubblicious Portfolio.” Infuriating indeed. Actually it should not be.

On a risk-adjusted basis, the prudent investor is not missing much.

When markets go up 10%, 20% or more in short periods, market participants think of their gains as money in the bank. Yet, that’s not true unless you sell and cash out of the market. Few do this because they’re afraid to “miss out” on continued gains.

The problem comes when the bubble bursts and losses of 30%, 40% or more pile up quickly. Investors tell themselves they’ll be smart enough to get out in time, but that’s not true either.

Typically investors don’t believe the tape. They “buy the dips,” (which keep dipping lower), then they refuse to sell until they “get back to even,” which can take ten years. These are predictable behaviors of real investors caught up in real bubbles.

It’s better just to diversity, build up a cash reserve, have some gold for catastrophe insurance, and then wait out the bubble crowd. When the crash comes, which it always does, you’ll be well positioned to shop for high-quality bargains amid the rubble. Then you’ll participate in the next long upswing without today’s risks of a sudden meltdown.

OK, so I just argued that the stock market (and other markets) are in bubbles. But where’s the actual proof for this?

Actually, it’s everywhere.

The Shiller CAPE ratio (a good indicator of how expensive stocks are) is at levels only seen at the 1929 crash that started the Great Depression, and the 2000 dot.com bubble. Likewise, the market capitalization-to-GDP ratio is above the level of the 2008 panic and comparable to the 1929 crash.

The list goes on, including historically low volatility and unprecedented complacency on the part of investors.

For almost a year, one of the most profitable trading strategies has been to sell volatility. That’s about to change…

Since the election of Donald Trump stocks have been a one-way bet. They almost always go up, and have hit record highs day after day. The strategy of selling volatility has been so profitable that promoters tout it to investors as a source of “steady, low-risk income.”

Nothing could be further from the truth.

Yes, sellers of volatility have made steady profits the past year. But the strategy is extremely risky and you could lose all of your profits in a single bad day.

Think of this strategy as betting your life’s savings on red at a roulette table. If the wheel comes up red, you double your money. But if you keep playing eventually the wheel will come up black and you’ll lose everything.

That’s what it’s like to sell volatility. It feels good for a while, but eventually a black swan appears like the black number on the roulette wheel, and the sellers get wiped out. I focus on the shocks and unexpected events that others don’t see.

In short, we have been on a volatility holiday. Volatility is historically low and has remained so for an unusually long period of time. The sellers of volatility have been collecting “steady income,” yet this is really just a winning streak at the volatility casino.

I expect the wheel of fortune to turn and for luck to run out for the sellers.

But it’s time to add another warning sign to the list. Certain high-yield (or “junk bond”) indices have fallen below their 200-day moving average. This can be indicative of a stock market correction.

Junk bonds are riskier than equity. When they get in trouble, it’s a sign that the corporate issuers are having trouble meeting their obligations. That in turn is indicative of reduced revenues or profits, tight financial conditions, and lower earnings.

Panics in October 1987 and December 1994 were preceded by distress in bonds about six months earlier. While there is no deterministic relationship, bonds are a good leading indicator of stocks because they are higher in the capital table and feel distress sooner. The October 1987 one-day 22% decline in stocks, and the December 1994 Tequila Crisis in Mexican debt were ugly for investors. The bond market gave a six-month early warning both times.

It may be doing so again.

But what the Fed? Is it setting markets up for a fall?

It’s true that the Fed has been raising interest rates since 2015, and had engaged in tapering for two years before that. Yet, these actions hardly constitute tight money. The tightness or ease of monetary policy needs to be judged relative to financial and economic conditions.

You can have “easy money” at a 10% interest rate if inflation is running at 15% (something like the conditions of the late 1970s). In that world, the real interest rate is negative 5.0%, (10% – 15% = -5%).

In effect, the bank pays you to borrow. That’s easy money.

By most models including the famous Taylor Rule, rates in the U.S. today should be about 2.5% instead of 1.0%. We have easy money today and have had since 2006. This comes on top of the “too low, for too long” policy of Alan Greenspan from 2002-04, which led directly to the housing bubble and collapse in 2007.

The U.S. really has not had a hard money period since the mid-1990s. That’s true of most of the developed economies also.

What’s going to happen when central banks start to normalize interest rates and balance sheets and return to a true tight money policy in preparation for the next recession?

We’re about to find out.

Central banks all over the world including the Fed, ECB, and the People’s Bank of China are in the early stages of ending their decade-long (or longer) easy money policies. This tightening trend has little to do with inflation (there isn’t any) and more to do with deflating asset bubbles and getting ready for a new downturn.

But, in following this policy, central bankers may actually pop the bubbles and cause the downturn they are getting ready to cure. This is one more reason, in addition to those described above, why the stock market bubble is about to implode.

It’s important to realize that market crashes often happen not when everyone is worried about them, but when no one is worried about them.

Complacency and overconfidence are good leading indicators of an overvalued market set for a correction or worse.

- Source, James Rickards via the Daily Reckoning

Sunday, December 17, 2017

Gold, Interest Rates and Super Cycles


When the Fed raised interest rates last December, many believed gold would plunge. But it didn’t happen.

Gold bottomed the day after the rate hike, but then started moving higher again.

Incidentally, the same thing happened after the Fed tightened in December 2015. Gold had one of its best quarters in 20 years in the first quarter of 2016. So it was very interesting to see gold going up despite headwinds from the Fed.

Meanwhile, gold has more than held its own this year.

Normally when rates go up, the dollar strengthens and gold weakens. They usually move in opposite directions. So how could gold have gone up when the Fed was tightening and the dollar was strong?

That tells me that there’s more to the story, that there’s more going on behind the scenes that’s been driving the gold price higher.

It means you can’t just look at the dollar. The dollar’s an important driver of the gold price, no doubt. But so are basic fundamentals like supply and demand in the physical gold market.

I travel constantly, and I was in Shanghai meeting with the largest gold dealers in China. I was also in Switzerland not too long ago, meeting with gold refiners and gold dealers.

I’ve heard the same stories from Switzerland to Shanghai and everywhere in between, that there are physical gold shortages popping up, and that refiners are having trouble sourcing gold. Refiners have waiting lists of buyers, and they can’t find the gold they need to maintain their refining operations.

And new gold discoveries are few and far between, so demand is outstripping supply. That’s why some of the opportunities we’ve uncovered in gold miners are so attractive right now. One good find can make investors fortunes.

My point is that physical shortages have become an issue. That is an important driver of gold prices.

There’s another reason to believe that gold could be in a long-term trend right now.

To understand why, let’s first look at the long decline in gold prices from 2011 to 2015. The best explanation I’ve heard came from legendary commodities investor Jim Rogers. He personally believes that gold will end up in the $10,000 per ounce range, which I have also predicted.

This means the 50% retracement is behind us and gold is set for new all-time highs in the years ahead.

But Rogers makes the point that no commodity ever goes from a secular bottom to top without a 50% retracement along the way.

Gold bottomed at $255 per ounce in August 1999. From there, it turned decisively higher and rose 650% until it peaked near $1,900 in September 2011.

So gold rose $1,643 per ounce from August 1999 to September 2011.

A 50% retracement of that rally would take $821 per ounce off the price, putting gold at $1,077 when the retracement finished. That’s almost exactly where gold ended up on Nov. 27, 2015 ($1,058 per ounce).

This means the 50% retracement is behind us and gold is set for new all-time highs in the years ahead.

Why should investors believe gold won’t just get slammed again?

The answer is that there’s an important distinction between the 2011–15 price action and what’s going on now.

The four-year decline exhibited a pattern called “lower highs and lower lows.” While gold rallied and fell back, each peak was lower than the one before and each valley was lower than the one before also...

- Source, James Rickards via The Daily Reckoning, Read More Here

Thursday, December 14, 2017

Investing Overseas, and Why You Should Buy Gold


Business Insider executive editor Sara Silverstein talks about the iPhone X, the release of which many people thought would trigger a so-called upgrade supercycle. She breaks down a recent UBS report arguing that this isn't true, citing data showing that iPhone sales will remain flat from a year ago. UBS says that people are still most concerned about price and battery life, not the newly announced functions that Apple has been advertising so heavily. UBS still has a buy rating on the stock, despite the firm's reservations over the upgrade cycle.

Silverstein sits down with Jim Rickards, the editor of Strategic Intelligence and the author of Currency Wars: The Making of the Next Global Crisis. He breaks down his $10,000/oz price target for gold, saying that some central banks may have to resort to the gold standard to restore confidence in the markets. Rickards says that $10,000 is the perfect pricing in order to to avoid a disaster scenario. He says what reflects reality is "complexity theory," which has been successful in other fields, and for which he's been a pioneer for bringing to financial markets. Rickards shares his thoughts on the Fed, and questions why the central bank is unwinding its balance sheet while economic growth is slow. He says it's because the Fed is already preparing for the next recession.
In the Fidelity Insight of the week, Silverstein speaks to Bill Bower, a portfolio manager at the firm. He'd just returned from a visit to Japan, and tells Silverstein that when he invests there, he likes to look at individual stocks. Bower says that he's looking at secular growth ideas in factory automation, as well as more value-based names in the financial sector. He says that he's taken a recent liking to financials in European, where he sees opportunities due to earnings growth. In general, when Bower invests internationally, he's more interested in secular ideas than cyclical ones. He's specifically intrigued by China, which he says will transition from a centrally-planned economy to a consumer, and notes that technology and the internet caters to that space.

- Source, Business Insider

Monday, December 11, 2017

James Rickards: Predicting the Fed's Next Move


Everyone is wondering what the FED will do next? How will 2018 unfold, and can any profit be made from it, or are we simply staring down the barrel of a complete and utter collapse?

The FED is sending warning singles to anyone who cares to listen, and rates could move in a massive way throughout 2018. Jim Rickards breaks this down and much, much more with Albert Lu of The Power and Market Report.

- Source

Sunday, December 10, 2017

James Rickards Final Warning for 2018


James Rickards has been screaming to the rafters, to anyone who will listen. A crisis is coming and 2018 is going to be an ugly year. The geopolitical instabilities that we are witnessing have never been higher, and the pot is about to boil over. Don't say you haven't been warned.

- Video Source

Thursday, December 7, 2017

Thanks to the FED: A Major Gold Rally is Coming in 2018


For more than a month gold prices have been unable to break above the $1,300 level but one expert is not too concerned, noting that $10,000 gold may be on the horizon. Speaking with Kitco News, best-selling author Jim Rickards said the Federal Reserve could “catalyze a major gold rally.” Markets are pricing in a nearly 100% chance the Fed will hike rates in December and if they don’t, Rickards said the metal may skyrocket. After that, he wouldn’t be surprised to see prices jump even further up. “My intermediate target is $10,000 an ounce.”

- Source, Kitco News

Monday, December 4, 2017

Jim Rickards on Bitcoin, Gold, and Fed Printing Money


James Rickards and Alex Stanczyk break down the current markets that we live in. How does gold play a role in these turbulent times and what can you do to protect yourself against the coming collapse?

Can the FED stop it, or will their uncontrolled money printing be the end of us all?

- Video Source

Friday, December 1, 2017

Enough About Bitcoin, Gold Is Headed to $10,000


The Federal Reserve could provide the ammo that blasts gold into its next major rally - a rally that could push prices up as high as $10,000 an ounce, according to one famed investor.

On the sidelines of the Silver and Gold Summit, best-selling author Jim Rickards told Kitco News that he is not convinced the Fed will raise rates next month at its monetary policy meeting, despite markets pricing in a nearly 100% chance.

The reason for his contrarian view is based on inflation, which will be in the spotlight this week with Thursday's release of the October core Personal Consumption Expenditures (PCE) Index. Core PCE is the central bank's preferred inflation measure as it strips out volatile energy and food prices.

"The Fed has a dual mandate: job creation and price stability. Job creation was mission accomplished a long time ago; that is not even a concern. Disinflation is a real concern," he said. "PCE core has gone down to flat nine months in a row from 1.9% to 1.3%, moving away from the Fed's target."

Rickards said that he expects the report to show PCE annual inflation growth of 1.3% or lower, adding that if this happens, there is no way the central bank will raise rates at its December meeting.

Because expectations are so high for a rate hike, Rickards said markets will take a "180-degree turn" if the Fed doesn't pull the trigger, which will drive gold prices higher.

"The euro will rally, the dollar will come down, [bond] yields will come down. That will catalyze a rally in gold," he said.

Rickards isn't the only one raising concerns over weak inflation pressures. Last week, the central bank showed ongoing concern of falling price pressures, as seen in its latest monetary policy meeting minutes.

"With core inflation readings continuing to surprise on the downside, however, many participants observed that there was some likelihood that inflation might remain below 2 percent for longer than they currently expected," the central bank said in the minutes. "A few other participants thought that additional policy firming should be deferred until incoming information confirmed that inflation was clearly on a path toward the Committee's symmetric 2 percent objective. A few participants cautioned that further increases in the target range for the federal funds rate while inflation remained persistently below 2 percent could unduly depress inflation expectations."

Since the release of the dovish minutes, gold has managed to push into striking distance of $1,300 an ounce. December gold futures last traded at $1,295 an ounce, up 0.60% on the day.

For Rickards, gold's struggle around $1,300 an ounce is a minor resistance point in what he sees as a much larger rally. In his latest interview, he maintained his view that gold prices could reach $10,000 an ounce.

"It's not a made-up number; I don't do it to get headlines," he said. "It is the price gold would have to be to avoid deflation."

- Source, The Street

Wednesday, November 22, 2017

Golden Catalysts Lay in Wait


The physical fundamentals are stronger than ever for gold. Russia and China continue to be huge buyers. China bans export of its 450 tons per year of physical production.

Gold refiners are working around the clock and cannot meet demand. Gold refiners are also having difficulty finding gold to refine as mining output, official bullion sales and scrap inflows all remain weak.

Private bullion continues to migrate from bank vaults at UBS and Credit Suisse into nonbank vaults at Brinks and Loomis, thus reducing the floating supply available for bank unallocated gold sales.

In other words, the physical supply situation has been tight as a drum.

The problem, of course, is unlimited selling in “paper” gold markets such as the Comex gold futures and similar instruments.

One of the flash crashes this year was precipitated by the instantaneous sale of gold futures contracts equal in underlying amount to 60 tons of physical gold. The largest bullion banks in the world could not source 60 tons of physical gold if they had months to do it.

There’s just not that much gold available. But in the paper gold market, there’s no limit on size, so anything goes.

There’s no sense complaining about this situation. It is what it is, and it won’t be broken up anytime soon. The main source of comfort is knowing that fundamentals always win in the long run even if there are temporary reversals. What you need to do is be patient, stay the course and buy strategically when the drawdowns emerge.

Where do we go from here?

There are many compelling reasons why gold should outperform over the coming months.

Deteriorating relations between the U.S. and Russia will only accelerate Russia’s efforts to diversify its reserves away from dollar assets (which can be frozen by the U.S. on a moment’s notice) to gold assets, which are immune to asset freezes and seizures.

The countdown to war with North Korea is underway, as I’ve explained repeatedly in these pages. A U.S. attack on the North Korean nuclear and missile weapons programs is likely by mid-2018.

Finally, we have to deal with our friends at the Fed. Good jobs numbers have given life to the view that the Fed will raise interest rates next month. The standard answer is that rate hikes make the dollar stronger and are a head wind for the dollar price of gold.

But I remain skeptical about a December hike. As I explained above, the market is looking in the wrong places for clues to Fed policy. Jobs reports are irrelevant; that was “mission accomplished” for the Fed years ago.

The key data are disinflation numbers. That’s what has the Fed concerned, and that’s why the Fed might pause again in December as it did last September.

We’ll have a better idea when PCE core inflation comes out Nov. 30.

Of course, the Fed’s main inflation metric has been moving in the wrong direction since January. The readings on the core PCE deflator year over year (the Fed’s preferred metric) were:

January 1.9%

February 1.9%

March 1.6%

April 1.6%

May 1.5%

June 1.5%

July 2017: 1.4%

- Source, Jim Rickards via the Daily Reckoning

Sunday, November 19, 2017

James Rickards: The FED, Gold and War


Author and analyst Jim Rickards joins us to discuss Fed policy, the gold price and the possibility of renewed war on the Korean Peninsula.

- Source, Sprott Money

Thursday, November 16, 2017

How Quantitative Tightening Will Be Inflationary, Than Deflationary


We recently had our quarterly advisory board discussion with special guest Ben Hunt, author of Epsilon Theory, a newsletter and website that examines markets through the lenses of game theory and history.

What we talked about during the call: How Quantitative Tightening will actually be inflationary, rather than deflationary. How narratives, not reality, drive markets. Why the US might go to war with North Korea in Q1 2018. How and when de-dollarization will happen.


- Source, In Gold We Trust

Monday, November 13, 2017

The World Continues to Disintegrate, Gold to Catapult Higher in 2018


ABC Bullion's Chief Economist Jordan Eliseo was fortunate enough to interview Jim Rickards, one of the world’s leading precious metal analysts and author of New York Times Bestsellers including the Death of Money, and Currency Wars. 

Jim shared his views on a variety of topics, including the performance of gold in 2017, US Monetary Policy, developments in Catalonia, the outlook in China, the potential for military conflict in Korea, and gold price drivers between now and the end of 2018.

- Source, ABC Bullion

Saturday, November 11, 2017

Prepare for a Chinese Maxi-devaluation

China is a relatively open economy; therefore it is subject to the impossible trinity. China has also been attempting to do the impossible in recent years with predictable results.

Beginning in 2008 China pegged its exchange rate to the U.S. dollar. China also had an open capital account to allow the free exchange of yuan for dollars, and China preferred an independent monetary policy.

The problem is that the Impossible Trinity says you can’t have all three. This model has been validated several times since 2008 as China has stumbled through a series of currency and monetary reversals.

For example, China’s attempted the impossible beginning in 2008 with a peg to the dollar around 6.80. This ended abruptly in June 2010 when China broke the currency peg and allowed it to rise from 6.82 to 6.05 by January 2014 — a 10% appreciation.

This exchange rate revaluation was partly in response to bitter complaints by U.S. Treasury Secretary Geithner about China’s “currency manipulation” through an artificially low peg to the dollar in the 2008 – 2010 period.

After 2013, China reversed course and pursued a steady devaluation of the yuan from 6.05 in January 2014 to 6.95 by December 2016. At the end of 2016, the Chinese yuan was back where it was when the U.S. was screaming “currency manipulation.”

Only now there was a new figure to point the finger at China. The new American critic was no longer the quiet Tim Geithner, but the bombastic Donald Trump.

Trump had threatened to label China a currency manipulator throughout his campaign from June 2015 to Election Day on November 8, 2016. Once Trump was elected, China engaged in a policy of currency war appeasement.

China actually propped up its currency with a soft peg. The trading range was especially tight in the first half of 2017, right around 6.85.

In contrast to the 2008 – 2010 peg, China avoided the impossible trinity this time by partially closing the capital account and by raising rates alongside the Fed, thereby abandoning its independent monetary policy.

This was also in contrast to China’s behavior when it first faced the failure of its efforts to beat impossible trinity. In 2015, China dodged the impossible trinity not by closing the capital account, but by breaking the currency peg.

In August 2015, China engineered a sudden shock devaluation of the yuan. The dollar gained 3% against the yuan in two days as China devalued.

The results were disastrous.

U.S. stocks fell 11% in a few weeks. There was a real threat of global financial contagion and a full-blown liquidity crisis. A crisis was averted by Fed jawboning, and a decision to put off the “liftoff” in U.S. interest rates from September 2015 to the following December.

China conducted another devaluation from November to December 2015. This time China did not execute a sneak attack, but did the devaluation in baby steps. This was stealth devaluation.

The results were just as disastrous as the prior August. U.S. stocks fell 11% from January 1, 2016 to February 10. 2016. Again, a greater crisis was averted only by a Fed decision to delay planned U.S. interest rate hikes in March and June 2016.

The impact these two prior devaluations had on the exchange rate is shown in the chart below.


Major moves in the dollar/yuan cross exchange rate (USD/CNY) have had powerful impacts on global markets. The August 2015 surprise yuan devaluation sent U.S. stocks reeling. Another slower devaluation did the same in early 2016. A stronger yuan in 2017 coincided with the Trump stock rally. A new devaluation is now underway and U.S. stocks may suffer again.

By mid-2017, the Trump administration was once again complaining about Chinese currency manipulation. This was partly in response to China’s failure to assist the United States in dealing with North Korea’s nuclear weapons development and missile testing programs.

For its part, China did not want a trade or currency war with the U.S. in advance of the National Congress of the Communist Party of China, which begins on October 18. President Xi Jinping was playing a delicate internal political game and did not want to rock the boat in international relations. China appeased the U.S. again by allowing the exchange rate to climb from 6.90 to 6.45 in the summer of 2017.


China escaped the impossible trinity in 2015 by devaluing their currency. China escaped the impossible trinity again in 2017 using a hat trick of partially closing the capital account, raising interest rates, and allowing the yuan to appreciate against the dollar thereby breaking the exchange rate peg.

The problem for China is that these solutions are all non-sustainable. China cannot keep the capital account closed without damaging badly needed capital inflows. Who will invest in China if you can’t get your money out?

China also cannot maintain high interest rates because the interest costs will bankrupt insolvent state owned enterprises and lead to an increase in unemployment, which is socially destabilizing.

China cannot maintain a strong yuan because that damages exports, hurts export-related jobs, and causes deflation to be imported through lower import prices. An artificially inflated currency also drains the foreign exchange reserves needed to maintain the peg.

Since the impossible trinity really is impossible in the long-run, and since China’s current solutions are non-sustainable, what can China do to solve its policy trilemma?

The most obvious course, and the one likely to be implemented, is a maxi-devaluation of the yuan to around the 7.95 level or lower.

This would stop capital outflows because those outflows are driven by devaluation fears. Once the devaluation happens, there is no longer any urgency about getting money out of China. In fact, new money should start to flow in to take advantage of much lower local currency prices.

There are early signs that this policy of devaluation is already being put into place. The yuan has dropped sharply in the past month from 6.45 to 6.62. This resembles the stealth devaluation of late 2015, but is somewhat more aggressive.

The geopolitical situation is also ripe for a Chinese devaluation policy. Once the National Party Congress is over in late October, President Xi will have secured his political ambitions and will no longer find it necessary to avoid rocking the boat.


China has clearly failed to have much impact on North Korea’s nuclear weapons ambitions. As war between North Korea and the U.S. draws closer, neither China nor the U.S. will have as much incentive to cooperate with each other on bilateral trade and currency issues.

Both Trump and Xi are readying a “gloves off” approach to a trade war and renewed currency war. A maxi-devaluation of the yuan is Xi’s most potent weapon.

Finally, China’s internal contradictions are catching up with it. China has to confront an insolvent banking system, a real estate bubble, and a $1 trillion wealth management product Ponzi scheme that is starting to fall apart.

A much weaker yuan would give China some policy space in terms of using its reserves to paper over some of these problems.

Less dramatic devaluations of the yuan led to U.S. stock market crashes. What does a new maxi-devaluation portend for U.S. stocks?

We might have an answer soon enough.

- Source, Jim Rickards via the Daily Reckoning

Wednesday, November 8, 2017

Markets Await Trump’s Decision on Fed Chair

President Trump is expected to nominate the next Federal Reserve chair within a matter of days.

As I’ve explained before, Donald Trump has the opportunity to appoint a higher percentage of the Board of Governors of the Federal Reserve system at one time than any president since Woodrow Wilson.

President Wilson signed the Federal Reserve Act during the creation of the Fed in 1913 when they had a vacant board. At that time, the law said the secretary of the Treasury and the comptroller of the currency were automatically on the Fed’s board of governors. But besides that, President Wilson selected all of the other participating members.

Due to vacancies he inherited and key resignations, Trump now has the opportunity to fill more seats on the Fed’s Board of Governors than any president since then.

That’s pretty amazing when you think about it.

To review, the Federal Reserve’s Board of Governors is made up of seven appointees. That means that they can make a majority decision with four votes. If you’re reading about the Fed, you might also see reference to “regional reserve bank presidents.” These are roles within the Federal Reserve System, but the real power is found on seven-member Board of Governors.

Trump will own the Fed.

Meaning, whatever the president wants monetary policy to be, he’ll get. In other words, Donald Trump will be able to shape the Fed’s majority. But the tricky part is figuring out how he plans to shape it…

During the campaign season, Trump called China and other nations currency manipulators. That signaled he believed the dollar was too strong and wanted it to weaken. But then the North Korean nuclear crisis rose to the fore.

Trump backed off his threats against China because China has the most economic influence over North Korea, and Trump wanted China to use that leverage to convince the North to back off its nuclear program.

But China didn’t deliver as Trump had hoped, and a trade war with China is now likely. That’s especially true now. Chinese president Xi Jinping has solidified his hold on power after the Chinese Politburo re-appointed him yesterday. Xi had avoided rocking the boat in recent months while his position was uncertain. But now that his lock on power is secure, Xi can afford to be much more confrontational with Trump.

Trump’s trade policy has led many to believe that Trump will appoint a lot of “doves” to the Board. But don’t be surprised if Trump goes with a hard-money board. In fact, that’s what I expect. These will be hard-money, strong-dollar people, contrary to a lot of expectations.

Trump advisers include hard-money advocates like Dr. Judy Shelton, David Malpass, Steve Moore and Larry Kudlow. I expect Trump to heed their advice.

Which brings us to Janet Yellen and the next Federal Reserve Chair…

Janet Yellen’s term as chair is up at the end of January — just over three months from now. Whoever President Trump appoints to replace her will be subject to Senate confirmation.

Because that process takes time, that means the president has to name Yellen’s successor around November or December.

And again, he’s expected to make that announcement by Nov. 3, before he heads to China.

The market is tightly focused on President Trump’s pick. As of October 23, betting markets had the approximate probabilities as follows:

Jay Powell — 51%

Janet Yellen — 17%

John Taylor — 15%

Kevin Warsh — 11%

Gary Cohn — 4%

Neel Kashkari — 2%

Powell’s main qualification seems to be that he’s just like Yellen except he’s a Republican. So, if we combine their votes, that a 68% chance that policy will continue unchanged, which means more rate hikes ahead.

The next in line is John Taylor, who is considered the most hawkish of the group. If we add his votes to the Powell + Yellen pool, that an 85% probability that policy will either be the same or tighter.

No relief for gold in the Fed sweepstakes.

Now, as I’ve been saying for months, my money’s on Kevin Warsh. Warsh is the likely next chair of the Fed.

Warsh has previously served on the board. After being nominated by President George W. Bush he was a Fed governor where he served from 2006 until he resigned early in 2011.

Kevin Warsh is a pragmatist, not an ideologue like Yellen. He’s not beholden to obsolete Fed models like Phillips curve that says low unemployment means higher inflation. Warsh understands that disinflation is a serious problem for a country with a 105% debt-to-GDP ratio, like the U.S.

Warsh and the pragmatists understand that inflation is needed for the U.S. to have any hope of getting the debt problem under control.

Warsh believed that the Federal Reserve should have raised interest rates a long time ago. But with disinflation a much more pressing concern than inflation right now, being a pragmatist means he won’t commit to tightening if conditions don’t warrant it.

We’ll see how this all plays out probably late this week or early next before Trump leaves for China.

But it’s important to realize that institutions boil down to people. And there’s going to be a lot of turnover at the Fed under Trump. It’s not just limited to his choice of Fed chair.

Yes, Yellen will likely be out. But so are Fed officials that align with her, like Vice President Stanley Fischer, who announced his resignation in September.

As I indicated, the new, emerging Fed will have less faith in traditional models. For example, in September, Fed governor Lael Brainard delivered one of the most significant Fed speeches ever. Translating from Fed-speak to plain English, she more or less admitted the Fed has no idea how inflation works.

Brainard pointed out that the Fed began its current monetary policy tightening cycle in the belief that tight labor markets implied inflation was coming with a lag. The Fed raised rates in December 2015, December 2016, March 2017 and June 2017 in part to get out ahead of this coming inflation.

Instead the opposite happened.

The Fed’s favorite measure of inflation plunged from 1.9% to 1.3% between January and August 2017 even as job creation continued and the unemployment rate fell. In other words, the relationship between tight labor markets and inflation turned out to be the exact opposite of what the Fed believed.

Their models are in ruins.

Of course, this is what I’ve been telling my readers to expect all year. The Fed was tightening into weakness, not strength, and would soon have to flip back to ease in order to avoid an outright U.S. recession. And ease is exactly what Brainard called for in her speech.

In the meantime, a lot of uncertainty over the Fed’s direction will hover over the market, as if there wasn’t enough uncertainty in the market already.

But one thing is certain:

The next Fed head will have a lot on his (or her) plate.

The biggest winner will be gold. The time to enter your gold position, if you don’t already have one, is now.

- Source, James Rickards via the Daily Reckoning

Sunday, November 5, 2017

Jim Rickards: Is Bitcoin a Ponzi Scheme?


JPMorgan CEO Jamie Dimon recently called bitcoin a “fraud” that “won’t end well.” The cryptocurrency is up 800% in the past year. So bitcoin investors can have a good laugh at Mr. Dimon’s expense, for now.

Important questions and skepticism remain. Among the cryptocurrency's big skeptics is currency guru and bestselling author Jim Rickards. He sat down to discuss this (and much more) during a new "Real Conversation" with Hedgeye CEO Keith McCullough.

Rickards begins: “This is the only topic where I agree with Jamie Dimon. I've been a pretty harsh critic of Jamie Dimon. But when he says 'it’s a fraud, it's a Ponzi'[ scheme]'-- I agree completely. I call it a Ponzi with no one in charge. There's no Madoff, but it's working that way.”

While bitcoin has its fervent supporters, Rickards says the cryptocurrency invented in 2009 still has too much to prove, and is involved in too many shady transactions to be taken seriously. He cites things like drug dealing, arms dealing, money laundering and tax evasion, as well as "worse things that I don't want to even mention, more reprehensible than that.

"He goes on further: “Bitcoin has not been combat tested in a business cycle. We have not had a recession or a financial crisis since 2009. I’ve seen all these other asset classes go through many business cycles. I know how they’ll behave. Bitcoin has not been tested in that arena.”

Rickards and McCullough both say they have both been accused of being "technophobic" because of their distaste for bitcoin. Rickards says that couldn’t be further from the truth.“A lot of my private equity investments are very forward-leaning in technology. I embrace technology. But I know a lot about markets. A lot of the tech groupies who love bitcoin know a lot about tech, but not so much about the markets.”Until proven otherwise, Rickards says investors should stay away.“For the market as a whole, for wealth managers, for people trying to preserve wealth, for investors, this is no place to be,” Rickards says.


- Source, Hedgeye

Thursday, November 2, 2017

The Greatest Fear Today: The Lack of Fear


Market crashes often happen not when everyone is worried about them, but when no one is worried about them.

Complacency and overconfidence are good leading indicators of an overvalued market set for a correction or worse. Prominent magazine covers are notorious for declaring a boundless bull market right at the top just before a crash or correction.

October 19 saw the thirtieth anniversary of the greatest one-day percentage stock market crash in U.S. history — a 22% fall on October 19, 1987. In today’s Dow points, a 22% decline would equal a one-day drop of over 5,000 points!

I remember October 19, 1987 well. I was chief credit officer of a major government bond dealer. We didn’t have the internet back then, but we did have trading screens with live quotes. I couldn’t believe what I was watching at first, but by 2:00 in the afternoon we were all glued to our screens.

It was like being a passenger on a plane that was crashing, but you had no way out of the plane. Our firm was fine (bonds rallied as stocks crashed), but we were concerned about counterparties going bankrupt and not being able to pay us on our winning bets in bonds.

What’s troubling is that a lot of commentators said that the kind of crash that took place in 1987 couldn’t happen today and that markets were much safer. It’s true that circuit breakers and market closures could temporarily halt a slide better than we did in 1987. But those devices buy time, they don’t solve the underlying fear and panic that causes market crashes.

In any case, when I hear market pros say “It can’t happen again” it sounds to me like another market crash is just around the corner.

The problem with a market meltdown in today’s even more deeply interconnected markets, is that once it strikes, it’s difficult to contain. It can spread rapidly. Likewise, there’s no guarantee that a stock market meltdown will be contained to stocks.

Panic can quickly spread to bonds, emerging markets, and currencies in a general liquidity crisis as happened in 2008.

Why should investors be so concerned right now?

For almost a year, one of the most profitable trading strategies has been to sell volatility. That’s about to change…

Since the election of Donald Trump stocks have been a one-way bet. They almost always go up, and have hit record highs day after day. The strategy of selling volatility has been so profitable that promoters tout it to investors as a source of “steady, low-risk income.”

Nothing could be further from the truth.

Yes, sellers of volatility have made steady profits the past year. But the strategy is extremely risky and you could lose all of your profits in a single bad day.

Think of this strategy as betting your life’s savings on red at a roulette table. If the wheel comes up red, you double your money. But if you keep playing eventually the wheel will come up black and you’ll lose everything.

That’s what it’s like to sell volatility. It feels good for a while, but eventually a black swan appears like the black number on the roulette wheel, and the sellers get wiped out. I focus on the shocks and unexpected events that others don’t see.

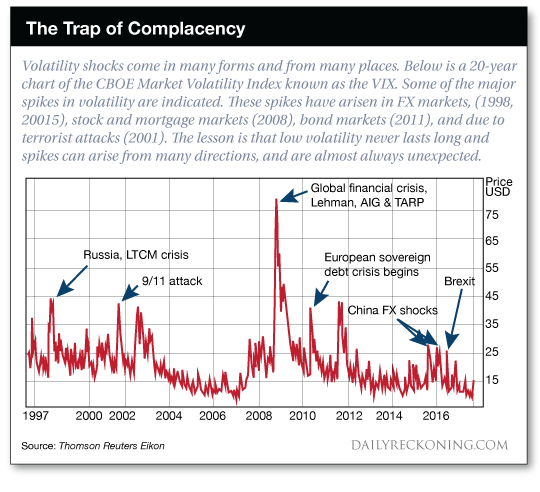
The chart below shows a 20-year history of volatility spikes. You can observe long periods of relatively low volatility such as 2004 to 2007, and 2013 to mid-2015, but these are inevitably followed by volatility super-spikes.

During these super-spikes the sellers of volatility are crushed, sometimes to the point of bankruptcy because they can’t cover their bets.

The period from mid-2015 to late 2016 saw some brief volatility spikes associated with the Chinese devaluation (August and December 2015), Brexit (June 23, 2016) and the election of Donald Trump (Nov. 8, 2016). But, none of these spikes reached the super-spike levels of 2008 – 2012.

In short, we have been on a volatility holiday. Volatility is historically low and has remained so for an unusually long period of time. The sellers of volatility have been collecting “steady income,” yet this is really just a winning streak at the volatility casino.

I expect the wheel of fortune to turn and for luck to run out for the sellers.


Here are the key volatility drivers we should be most concerned about:

The North Korean nuclear crisis is simply not going away. In fact, it seems to be getting worse. Intelligence indicates that North Korea successfully tested a hydrogen bomb in September. This is a major development.

An atomic weapon has to hit the target to destroy it. A hydrogen bomb just has to come close. This means than North Korea can pose an existential threat to U.S. cities even if its missile guidance systems are not quite perfected. Close is good enough.

A hydrogen bomb also gives North Korea the ability to unleash an electromagnetic pulse (EMP). In this scenario, the hydrogen bomb does not even strike the earth; it is detonated near the edge of space. The resulting electromagnetic wave from the release of energy could knock out the entire U.S. power grid.

Trump will not allow that to happen, and you can expect a U.S. attack, maybe early next year.

Another ticking time bomb for a volatility spike is Washington, DC dysfunction, and the potential for a government shutdown in December…

Analysts who warn about government shutdowns are often viewed as the boy who cried wolf. We’ve had a few government shutdowns in recent years, most recently in 2013, and two in the 1990s.

These were considered true government shutdowns in the sense that Congress did not authorize spending for any agency, and all “non-essential” government employees were put on furlough. (Critical functions such as military, TSA, postal service and air traffic control continue regardless of any shutdown).

These shutdowns don’t last long. They are usually for one political party or the other to make its point about spending priorities, and are soon compromised in the form of higher spending and a return to business as usual.

Government shutdowns because of lack of spending authority are different from government shutdowns due to lack of borrowing authority and the Treasury’s inability to pay its bills, or hitting the so-called “debt ceiling.”

We had a debt ceiling shutdown in 2011. Those are far more dangerous to markets because they call into question the Treasury’s ability to pay the national debt. We’ve had two near shutdowns this year; one in March, and again at the end of September. Both times Congress passed a last minute “continuing resolution” or CR that keeps government funding at current levels and keeps the doors open until a final budget can be worked out.

The current CR expires on December 8.

This time the odds are high that the government actually will shut down. Why should investors be any more concerned about this shutdown than the one in 2013 or the near misses earlier this year?

There are several causes for concern.

The first is that there is less room for compromise. The White House wants funding for the Wall with Mexico. Many Republican members of Congress want to defund Planned Parenthood. The Democrats will not vote for the Wall or to defund Planned Parenthood, but do want more funding for Obamacare.

There is no middle ground on any of these issues so the chance of a long shutdown is quite high.

The second reason is that this shutdown comes at a time when the U.S. in facing an increased risk of war with North Korea, and Congress has many other tasks on its plate including tax reform, confirmation of a new Fed Chairman, the “Dreamers” legislation, and more. Political dysfunction in Washington can easily spill over into markets.

This time the wolf may be real.

In short, the catalysts for a volatility spike are all in place. We could even get a record super-spike in volatility if several of these catalysts converge.

The “risk on / risk off” dynamic that has dominated most markets since 2013 is coming to an end. From now on it may just be “risk off” without much relief. The illusion of low volatility, ample liquidity, and ever rising stock prices is over.

It has been nine years since the last financial panic so a new one tomorrow should come as no surprise.

The safe havens will be the euro, cash, gold and low-debt emerging markets such as Russia. The areas to avoid are U.S. stocks, China, South Korea and heavily indebted emerging markets.

It may not look like it now, but it could be a volatile and bumpy ride ahead.


- Source, Jim Rickards via the Daily Reckoning

Monday, October 30, 2017

For the Central Bank of Russia This Is All That Matters


The World Gold Council has reported that the Central Bank of Russia has more than doubled the pace of its gold purchases, bringing its reserves to the highest level since Putin took power 17 years ago.

Russia’s desire to break away from the hegemony of the U.S. dollar and the dollar payment system is well-known. Over 60% of global reserves and 80% of global payments are in dollars. The U.S. is the only country with veto power at the International Monetary Fund, the global lender of last resort.

Perhaps Russia’s most aggressive weapon in its war on dollars is gold. The first line of defense is to acquire physical gold, which cannot be frozen out of the international payments system or hacked.

With gold, you can always pay another country just by putting the gold on an airplane and shipping it to the counterparty. This is the 21st-century equivalent of how J.P. Morgan settled payments in gold by ship or railroad in the early 20th century.

Russia has now tripled its gold reserves from around 600 tonnes to 1,800 tonnes over the past 10 years and shows no signs of slowing down. Even when oil prices and Russian reserves were collapsing in 2015, Russia continued to acquire gold.

But Russia is pursuing other dollar alternatives besides gold.

For one, it’s been building nondollar payments systems with regional trading partners and China.

The U.S. uses its influence at SWIFT, the central nervous system of global money transfer message traffic, to cut off nations it considers to be threats.

From a financial perspective, this is like cutting off oxygen to a patient in the intensive care unit. Russia understands its vulnerability to U.S. domination and wants to reduce that vulnerability.

Now Russia has created an alternative to SWIFT...


- Source, Jim Rickards via the Daily Reckoning, Read More Here

Friday, October 27, 2017

Four Major Catalysts for Gold


The Federal Reserve would like to continue “normalizing” interest rates. But the most recent economic data simply does not justify it.

On Sept. 29, the August core PCE year-over-year (YoY) inflation figure was released. And the data came in exactly as I expected. YoY inflation for August was just 1.3%, down 0.6% from the January reading of 1.9%. That marked eight consecutive months of flat or lower readings.

Needless to say, the Fed is miles away from their 2.0% target. They’re actually moving consistently in the wrong direction.

Second, the September employment report came out the Friday before last. A Reuters survey of economists had expected the economy to add 90,000 jobs in September.

How many did it really add?

Not zero, but less than zero. The economy shed 33,000 jobs last month. This was the first time in seven years that the U.S. economy lost jobs.

Now, that may be partly due to the recent hurricanes that struck Texas and Florida. But coming on top of the weak inflation data that also came out, it will certainly give the Fed more than enough reason to hit the “pause” button on a December rate hike.

But incredibly, right now markets are giving a nearly 90% chance of a rate hike in December based on CME Fed Funds futures. That rate will drop significantly by December 13 when the FOMC meets again with a press conference. (There’s another meeting on November 1, but no one expects any policy changes then).

Once the market wakes up to the real state of play, probably in late November or early December, the current trends will suddenly reverse. You’ll see the dollar down and gold, euros and bond prices up.

On that score, one of the largest and most conservative wealth managers in the world, Pictet Group, based in Geneva, Switzerland, offers a very constructive view on gold.

Pictet’s strategist, Luc Luyet, says that the Fed will be on hold for the rest of 2017 and most of 2018 because of U.S. disinflation and the failure of President Trump to deliver on his growth agenda. I agree.

With the Fed in easing mode, the dollar will weaken and the dollar price of gold will remain strong. This is a fundamental case for gold that does not take into account other positive vectors such as geopolitical shocks from North Korea or outright assaults on the dollar from Russia and China (see below for more on these).

When a conservative institution like Pictet Group has a kind word for gold, you know the rest of the institutional world will not be far behind.

This all makes the next few weeks an excellent entry point for gold and gold mining stocks. You have a chance to take advantage of weakness and position ahead of the rally to come when reality sets in.

Another tailwind for gold is the continuing nuclear standoff with North Korea, as I hinted at above.

There is no doubt that North Korea and the U.S. are on a collision course and headed for war unless North Korea relents, which seems unlikely, or the U.S. acquiesces to North Korean possession of nuclear weapons, which is also unlikely.

At this point, it’s almost certainly too late for negotiation or diplomacy.

The U.S. only has two choices now. The first is to do nothing and learn to live with nuclear blackmail from North Korea. As I said, that is unlikely. The second option is to attack, probably within the next six months, to destroy the Kim regime and its weapons programs.

Trump will go for the attack option.

You don’t even need to ask what will happen to gold prices in that scenario. They’ll skyrocket and then much higher from there as the repercussions begin.

This is just another reason to acquire physical gold and gold mining stocks if you don’t already have them is now.

Another key gold story last week was a report that China has upped its estimate of proven gold reserves to 12,100 tonnes. This report was the source of a lot of confusion among those who follow China, Russia, gold and the status of the U.S. dollar.

Some readers took the word “reserves” to refer to China’s official gold reserves held by the People’s Bank of China and its off-the-books sister entity, the State Administration of Foreign Exchange (SAFE). That’s incorrect.

China’s official gold reserves are about 1,800 tonnes, but may be as high as 5,000 tonnes once off-the-books gold is counted. Some think it’s even higher.

But the report refers to “proven reserves,” which is a geologic (and engineering) concept familiar to the mining community. Basically, it’s an estimate of how much gold is buried in the ground in China and could feasibly be mined at current prices with current technology.

12,000 tonnes is still a lot of gold, but it will take 10 years or more and billions of dollars to dig it up and refine it. Even at 1,000 tonnes per year (double China’s current rate of production), this only increases gold supply about 0.5% per year. That would happen in conjunction with a diminution of gold output from traditional sources such as South Africa.

So increased Chinese gold production may replace diminished South African production, but it does not signify a major increase in global production. It’s worth noting, but not a game changer.

Still, the timing is curious because it comes just two weeks after China launched its oil-for-yuan attack on the petrodollar, with the yuan backed up by gold available from the Shanghai Gold Exchange.

In order for the oil-yuan-gold deal to be credible, China needs to show that it could deliver physical gold to the exchange without touching official reserves. This report makes it clear that China will have ample internal gold supplies for years to come. This adds credibility to its plan to price oil in yuan convertible to gold.

If China relied exclusively on gold imports, it could be strangled by gold sanctions aimed at China by the U.S. and its allies such as Canada and Australia. Instead, China looks ready to go it alone with its own gold. That’s a very big deal and one more nail in the petrodollar’s coffin.

It’s also extremely bullish for gold. Any effort to monetize gold implies much higher gold prices in order to avoid deflation given current gold-to-money ratios.

This is just one more reason to position in gold before this horse leaves the barn.

Finally, we need to consider the difficulty of physical gold supplies to keep up with increasing demand. The global gold supply increases only about 1.6% per year, and the floating supply of gold has been disappearing into private vaults from Zurich to Shanghai.

Refiners cannot find enough “scrap” gold (your discarded jewelry) to produce fine gold to meet demand. If demand increases appreciably from here, and there’s excellent reason to believe it will, there’s only one solution to the shortage of gold supply. And that’s much higher prices.

There, four catalysts waiting to send gold much higher. The time to move into gold is now before it resumes its upward climb.


- Source, James Rickards

Tuesday, October 24, 2017

James Rickards: North Korea Thinks the US is Bluffing, It's Not


Is there a danger in October as many believe there could be? Four time best-selling author James Rickards says “yes,” and it comes from increased tensions with North Korea. Rickards says, “We have a window from October 10th to October 21st. What is the significance of that window? 

October 10th is the anniversary of the communist party of North Korea. Kim Jong Un is getting ready to test more missiles. . . . We have two catalysts: the anniversary on October 10th and war games (with South Korea) on October 21st. In that window is when I expect one or more missile tests. That’s going to be another wake up call to the markets. 

The markets are sleepwalking . . . they don’t understand this war is coming, and it is coming. A shooting war, a pre-emptive war, a kinetic war with the United States against North Korea, I do expect by mid-2018...

Kim Jong Un thinks we are bluffing. We are not.” Rickards also restates his case for “$10,000 gold” and contends it’s at a relatively low price, and people should buy it now and simply hold it.

- Source, USA Watchdog

Saturday, October 21, 2017

James Rickards: The Ongoing Currency Wars, The Fate of the USD Dollar and It's Future


James Rickards is the author of the bestseller, Currency Wars, with an updated version later this year, talks about currency wars, the dollar and what’s coming.

- Source, Jay Taylor Media